After my last post on how often top podcasters publish, a reader suggested a great follow-up question: what are the episode length characteristics of these top 1,000 shows?
So I decided to tackle that next.
I pulled duration data for the same 1,000 shows.
My usual style is to show the raw results first, then dive into analysis. But this dataset is pretty overwhelming with all the charts and tables, so I’m switching it up: I’ll start with the key observations and summary, then give you the detailed breakdown of the raw data if you want to dig deeper into the numbers.
Results
Key Findings
The overall distribution shows most podcasts (85%) run 20-90 minutes. But does publishing frequency actually affect episode length? It looks like it does. Here are the numbers, with more analysis below.
Overall length snapshot:
| Scope | Shows | Median | Average | Typical Range (p10-p90) |
|---|---|---|---|---|
| Overall | 1,000 | 53.5 min | 58.1 min | 28-93 min |
Cadence comparison (daily → monthly):
| Cadence | Shows | Median | Average | Typical Range (p10-p90) |
|---|---|---|---|---|
| Daily | 180 | 42.0 min | 47.4 min | 19-81 min |
| Near-daily | 132 | 59.5 min | 62.1 min | 35-93 min |
| Weekly | 588 | 55.9 min | 61.0 min | 33-95 min |
| Monthly | 80 | 49.6 min | 58.7 min | 32-92 min |
Quick explainer:
- Median: The midpoint - half the shows are shorter, half are longer
- Average: Simple mean of all episode lengths
- Range (p10-p90): Typical low and high values after removing the 10% shortest and 10% longest episodes (cuts out extreme outliers)
- Sample size: Up to 40 recent episodes per show
Publishing cadence definitions (from my previous analysis):
| Cadence | Definition | Shows |
|---|---|---|
| Daily | ~1 day between episodes | 180 |
| Near-daily | ≤3 days between episodes | 132 |
| Weekly | 3-9 days between episodes | 588 |
| Monthly | 10-29 days between episodes | 80 |
| Other | >30 days between episodes | 20 |
Most top podcasts fall between 40 and 90 minutes. That middle band shows up again and again in the charts below.
Key observations:
Publishing frequency clearly affects episode length, with some surprising patterns:
-
Daily shows are significantly shorter. 42-minute median vs 55-59 minutes for others. There’s a strong difference here - daily publishing seems to force shorter, more sustainable episode lengths. Most daily shows cluster around 20-60 minutes, though there are extremes like Joe Rogan at 172 minutes.
-
Near-daily shows are actually the longest. 59.5-minute median - even longer than weekly shows. This is quite surprising to me. I’ve double-checked the data, but I’m not entirely sure why this pattern exists. The majority cluster around 40-90 minutes. I’ll need to dig into the actual shows to understand what’s driving this.
-
Weekly shows have the widest variation. From 33-95 minutes (p10-p90) - the biggest range of any cadence. This is probably because weekly creators can fit their content to whatever length it needs to be, without the pressure of daily sustainability or monthly production constraints. Most shows still cluster around 40-90 minutes, but you see significant outliers on both ends (6-minute educational snippets to 4+ hour deep dives).
-
Monthly shows are shorter than I expected. 49.6-minute median - I actually thought these would be much longer than weekly shows since they publish so infrequently. But they’re slightly shorter than the 55.9-minute weekly median. I’m not sure why this is the case - maybe they optimize for “substantial but not overwhelming” length, or maybe the smaller sample size (only 80 shows) is influencing this. Most cluster around 30-70 minutes. I’ll need to dig into the actual shows to understand this better.
Here’s the detailed breakdown by cadence:
Overall Duration Patterns
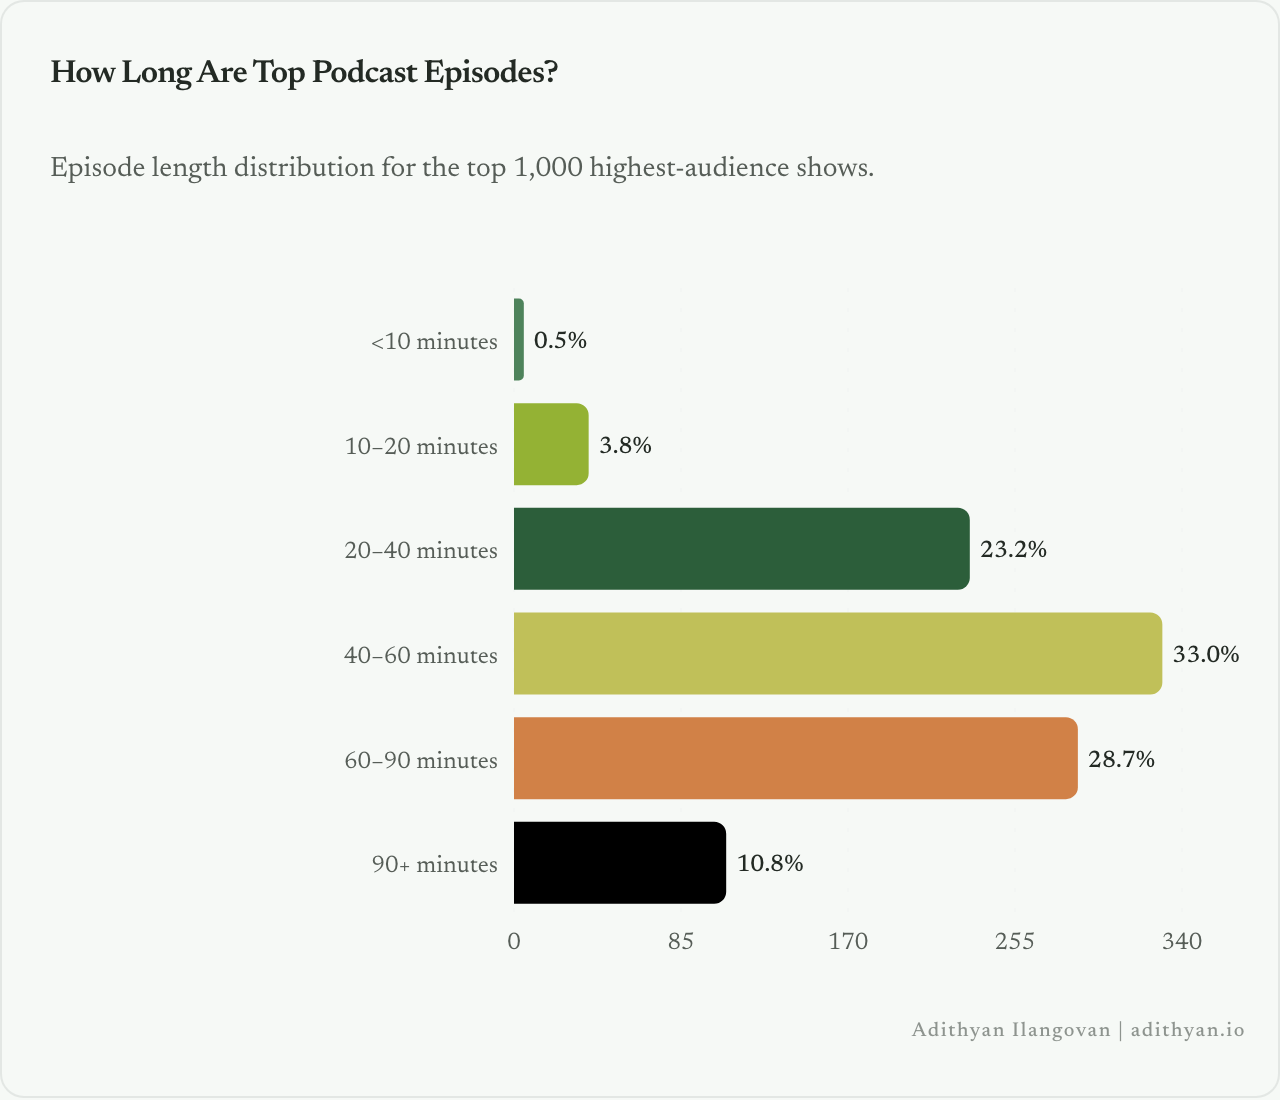
| Episode Length | Shows | Share |
|---|---|---|
| <10 minutes | 5 | 0.5% |
| 10-20 minutes | 38 | 3.8% |
| 20-40 minutes | 232 | 23.2% |
| 40-60 minutes | 330 | 33.0% |
| 60-90 minutes | 287 | 28.7% |
| 90+ minutes | 108 | 10.8% |
To be honest, this data is pretty noisy at the aggregate level. The real patterns emerge when you look at how episode length varies by publishing cadence. I focus the deeper charts on cadences with meaningful sample sizes (daily through monthly).
I removed the dedicated chart, values and table for the “Other” bucket. It has only 20 shows publishing slower than monthly, so the sample is too small to be trustworthy.
Cadence Breakdowns
Daily Shows (180 shows)
Average: 47.4 minutes | Median: 42.0 minutes
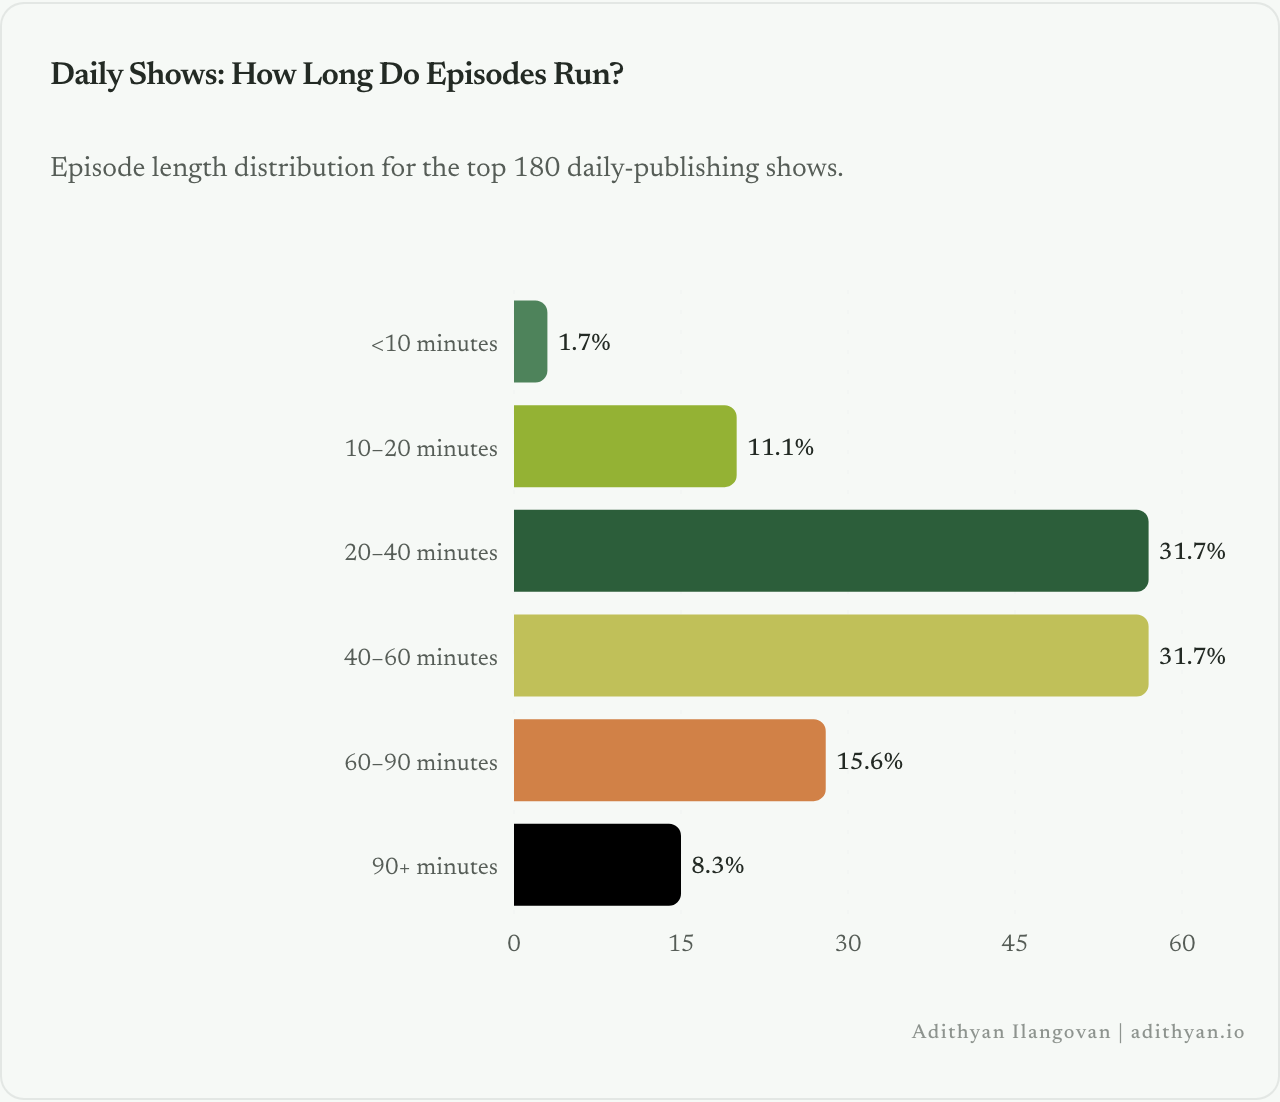
| Episode Length | Shows | Share |
|---|---|---|
| <10 minutes | 3 | 1.7% |
| 10-20 minutes | 20 | 11.1% |
| 20-40 minutes | 57 | 31.7% |
| 40-60 minutes | 57 | 31.7% |
| 60-90 minutes | 28 | 15.6% |
| 90+ minutes | 15 | 8.3% |
Near-Daily Shows (132 shows)
Average: 62.1 minutes | Median: 59.5 minutes
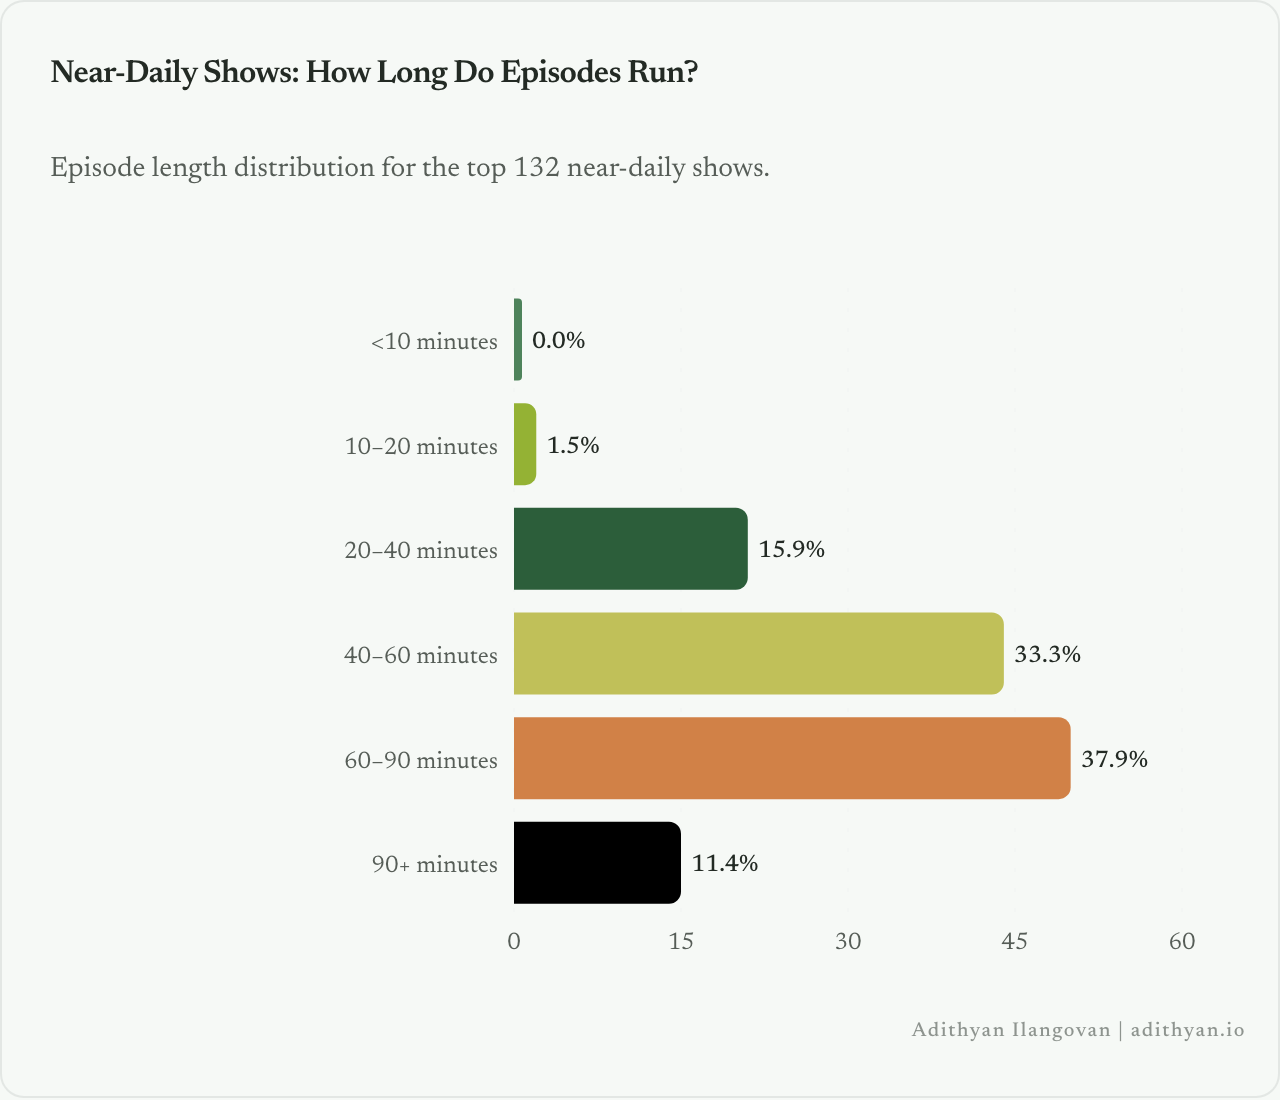
| Episode Length | Shows | Share |
|---|---|---|
| <10 minutes | 0 | 0.0% |
| 10-20 minutes | 2 | 1.5% |
| 20-40 minutes | 21 | 15.9% |
| 40-60 minutes | 44 | 33.3% |
| 60-90 minutes | 50 | 37.9% |
| 90+ minutes | 15 | 11.4% |
Weekly Shows (588 shows)
Average: 61.0 minutes | Median: 55.9 minutes
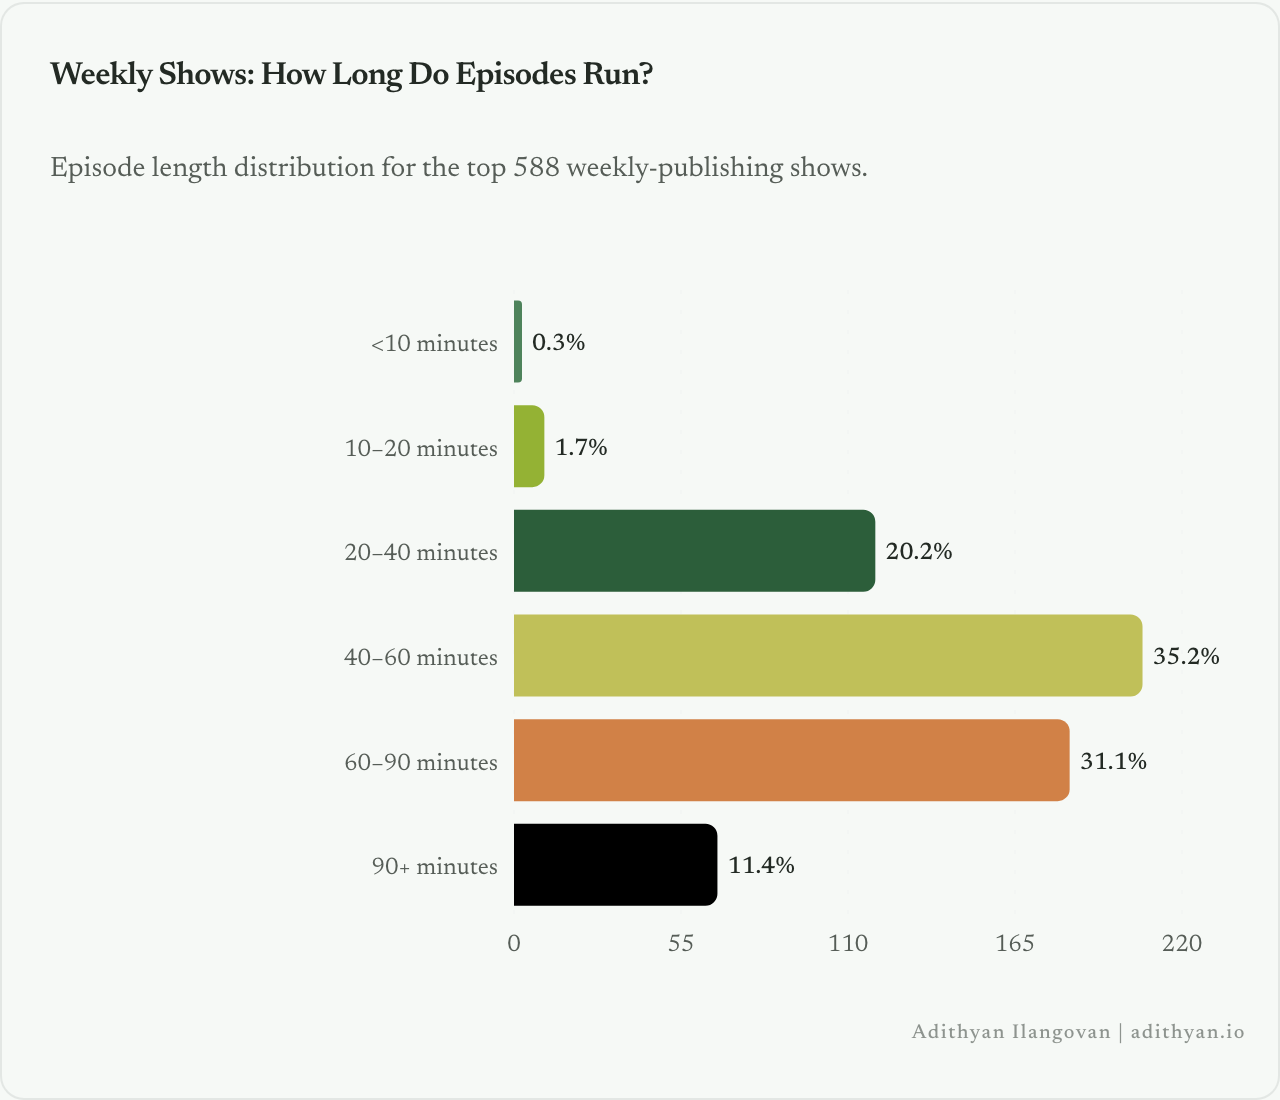
| Episode Length | Shows | Share |
|---|---|---|
| <10 minutes | 2 | 0.3% |
| 10-20 minutes | 10 | 1.7% |
| 20-40 minutes | 119 | 20.2% |
| 40-60 minutes | 207 | 35.2% |
| 60-90 minutes | 183 | 31.1% |
| 90+ minutes | 67 | 11.4% |
Monthly Shows (80 shows)
Average: 58.7 minutes | Median: 49.6 minutes
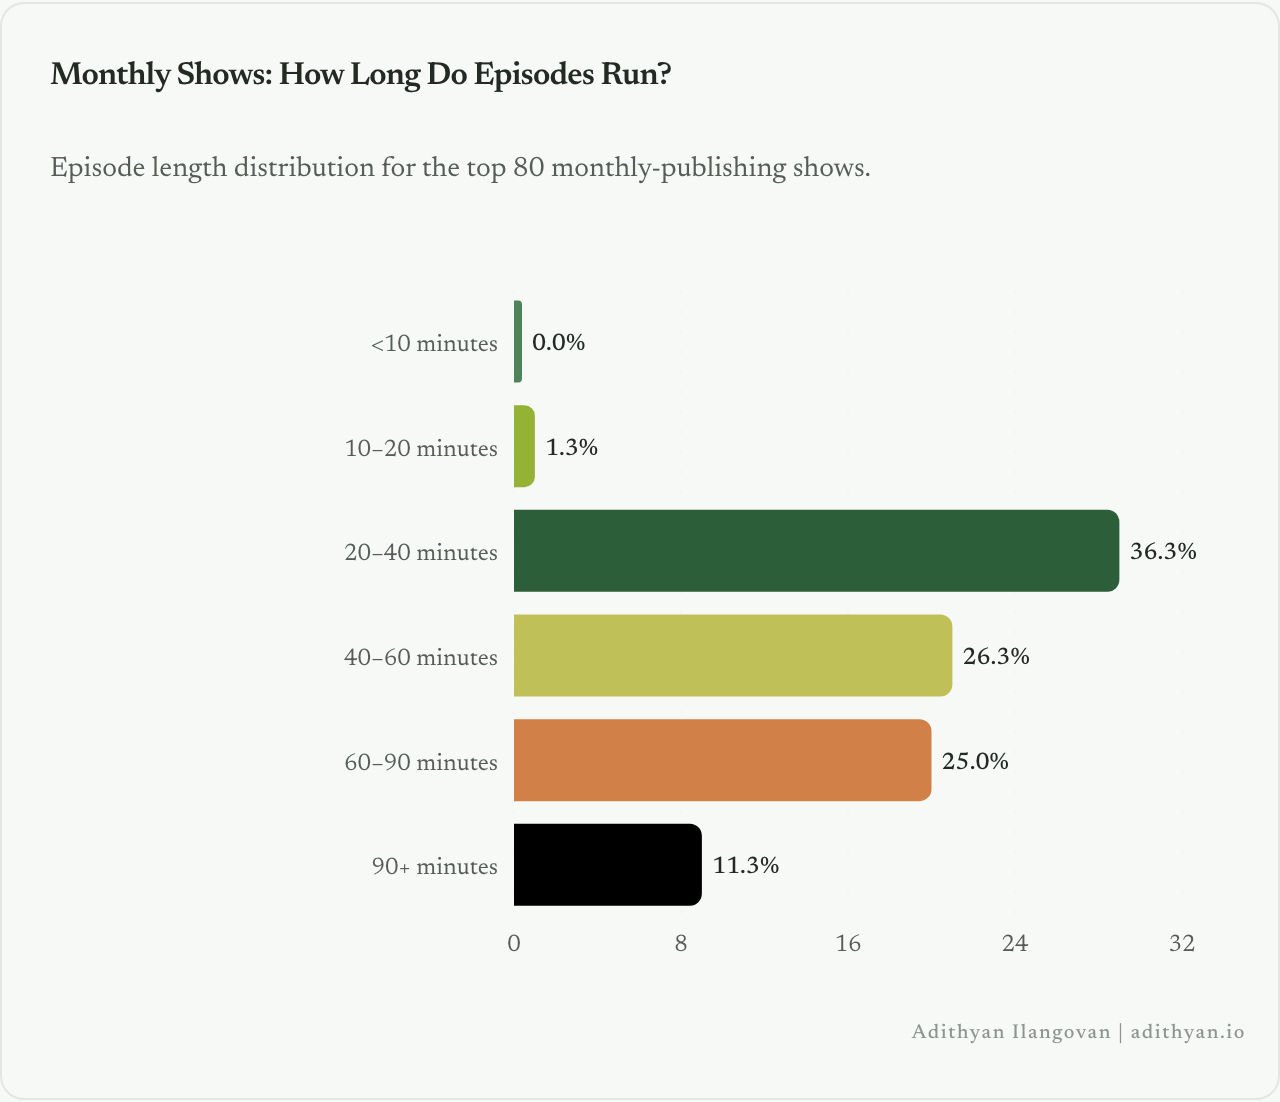
| Episode Length | Shows | Share |
|---|---|---|
| <10 minutes | 0 | 0.0% |
| 10-20 minutes | 1 | 1.3% |
| 20-40 minutes | 29 | 36.3% |
| 40-60 minutes | 21 | 26.3% |
| 60-90 minutes | 20 | 25.0% |
| 90+ minutes | 9 | 11.3% |
Methodology
The methodology was very similar to my last analysis:
- Started with the same top 1,000 podcasts by audience
- From their RSS feeds, pulled the most recent episodes per show (up to 40)
- Found the duration for each episode and calculated all the different metrics I’ve already explained above (median, average, p10-p90 ranges)
- Did this analysis once for all 1,000 shows, then broke them down by cadences and repeated the analysis for each group
That’s it. Simple enough that anyone can reproduce this.
What’s Next
Again, I had a lot of fun with this analysis. Lots of interesting and surprising patterns emerged, but to be honest, this also raised more questions than it answered.
One thing I realized is that I looked at this at a pretty surface level - just aggregate numbers and statistical patterns. I think I need to start looking into the actual shows to get a real tactile understanding. Why are near-daily shows longer? Also, I think something can only be gleaned from the actual shows by clicking and scrolling through the episodes.
I’ll also probably start linking the data for the top 1000 individual shows and linking them up here so if anybody else wants to explore the raw data, they can do their own analysis too.